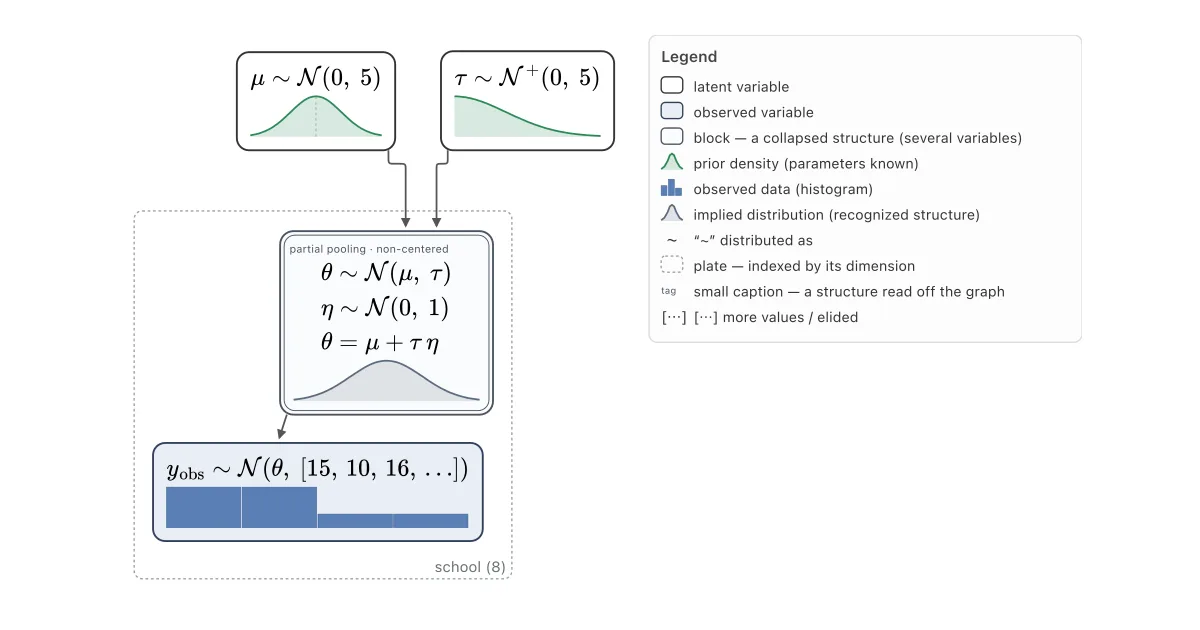
bayesDAG draws a PyMC model as a generative diagram in which every node whose shape is knowable shows it, so you can read the data-generating story off the curves, in the style of Kruschke's diagrams.
- Shapes, not just names. Each node carries its distribution's density, with real LaTeX inside the node and edges that point at the specific parameter they feed.
- Prior and posterior. Attach a fitted trace and the nodes overlay posterior on prior, with convergence diagnostics on the nodes.
- Static and interactive. A publication-quality SVG renderer and an interactive anywidget for Jupyter and marimo share one layout pass, so the diagram is the same in both.
It makes no causal claims. The arrows are the conditional-dependence arrows of a factorization, recovered from the model object, so the diagram will not label edges with effects or offer adjustment sets.
Status: pre-alpha.